
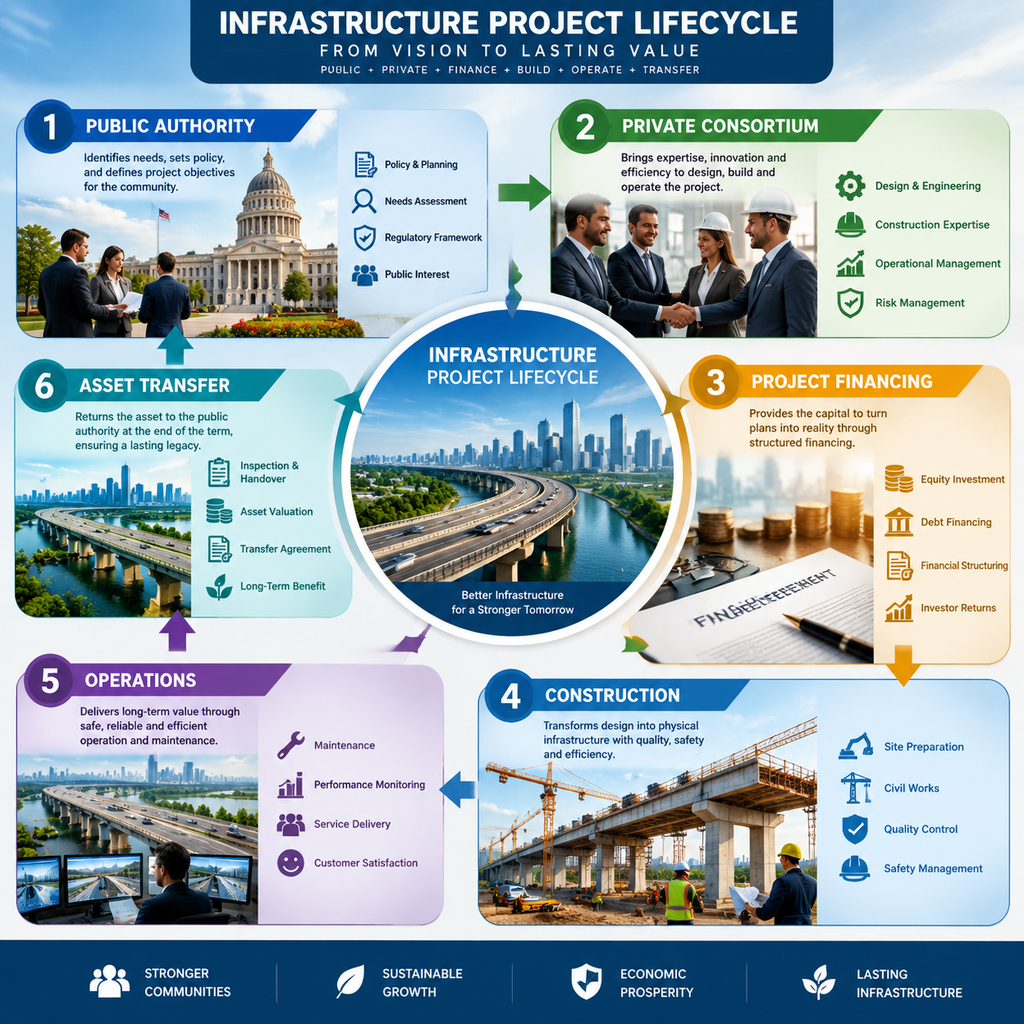

Financial Modeling for PPP Projects: Essential Components Every Bidder Must Understand
A PPP financial model is the backbone of any infrastructure bid. Get it wrong, and the concession agreement you spent months negotiating becomes worthless — either because lenders won't finance the deal or because the numbers don't survive contact with reality during construction. Get it right, and you have a credible, bankable structure that satisfies both the public authority and your debt providers.
This guide walks through each essential component in the order a bid team would actually build it — from revenue assumptions through to stress-testing — with the project finance context that generic corporate finance guides consistently miss.
What Is a PPP Financial Model and Why It Matters
A PPP financial model is a dynamic, integrated spreadsheet (or suite of spreadsheets) that projects all cash flows over the concession period, tests the financial viability of the project, and demonstrates to lenders and public authorities that the deal structure works under realistic and stressed conditions.
Unlike a standard corporate DCF, a project finance model for a PPP operates on a ring-fenced special purpose vehicle (SPV) basis. The SPV has no other assets or revenues — only those generated by the concession. This means every assumption carries disproportionate weight. A 5% error in traffic forecasts or a 10% construction cost overrun can flip a bankable project into one that breaches its debt covenants before the asset even opens.
The model serves three distinct audiences simultaneously: the equity sponsors assessing their return, the senior lenders sizing their debt, and the contracting authority verifying that the private partner can actually deliver. Structuring a model that speaks clearly to all three is the first practical challenge every bid team faces.
Revenue and Tariff Assumptions
Revenue projections define the ceiling of what any PPP can support in terms of debt and equity returns. The structure of those revenues — whether availability-based or demand-based — fundamentally changes the risk profile of the entire model.
Availability payments (common in social infrastructure like hospitals and schools) provide predictable, government-backed cash flows tied to service delivery standards rather than usage. These are generally easier to finance because demand risk sits with the public sector. User-fee models — toll roads, airports, water concessions — require detailed traffic or demand studies, and lenders will scrutinize the methodology aggressively.
Tariff escalation mechanisms deserve particular attention. Most concession agreements link tariffs to a price index (CPI, RPI, or a blended formula), but the lag between actual inflation and tariff adjustment can create short-term cash flow gaps. The model must capture this timing difference explicitly, not assume perfect pass-through.
One practical point: revenue assumptions should be benchmarked against comparable projects in the same sector and geography, not global averages. A toll road in Southeast Asia operates under very different demand elasticity conditions than one in Western Europe.
Capital and Operating Cost Structure
CapEx and OpEx inputs are where optimism bias most often enters a PPP model — and where lenders push back hardest during due diligence.
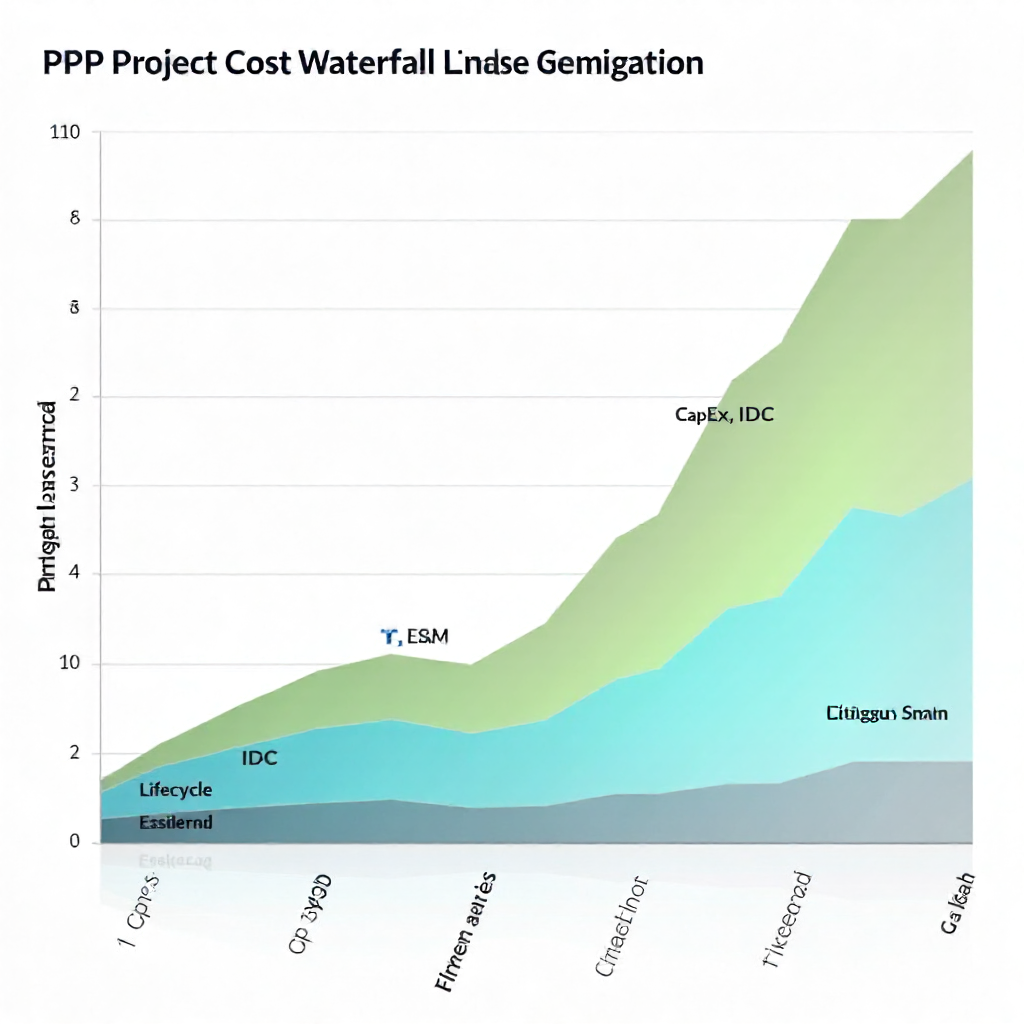
Capital expenditure in a PPP context includes not just construction costs but also land acquisition, design fees, permitting, insurance during construction, and the cost of financing itself (interest during construction, or IDC). All of these feed into the total project cost that determines how much debt needs to be raised.
Lifecycle costs are frequently underestimated. A 30-year concession will require major asset rehabilitation cycles — road resurfacing, equipment replacement, building refurbishments — and these need to be modeled as discrete capital events, not smoothed into annual OpEx. Most lenders require a maintenance reserve account funded from project cash flows precisely because lifecycle costs are lumpy and predictable in aggregate but uncertain in timing.
Operating expenditure should be broken into fixed and variable components. Fixed costs (staff, insurance, base maintenance) continue regardless of usage levels, which matters enormously in downside scenarios. Variable costs that scale with throughput provide some natural hedge in demand-based models.
Financing Structure and Debt Sizing
The financing structure of a PPP determines how much of the project cost is funded by senior debt versus equity, and on what terms. This is where bankability is won or lost.
Typical infrastructure PPPs are financed with debt-to-equity ratios ranging from 70:30 to 90:10, depending on revenue certainty and jurisdiction. Higher leverage amplifies equity returns but reduces resilience to cash flow shortfalls. Lenders will set a maximum debt quantum based on the project's ability to service that debt — measured primarily through the Debt Service Coverage Ratio (DSCR).
DSCR is calculated as cash available for debt service divided by scheduled debt service (principal plus interest) in any given period. Most senior lenders in infrastructure require a minimum annual DSCR of 1.20x to 1.30x, with a loan life coverage ratio (LLCR) of 1.30x to 1.40x across the full debt tenor. These are not arbitrary thresholds — they represent the buffer lenders need before a project technically defaults.
Loan tenor, interest rate assumptions (fixed vs. floating, with or without swap), and grace periods during construction all interact to shape the debt service profile. A model that shows DSCR compliance on average but dips below covenant levels in specific years will not be bankable without structural modifications — reserve accounts, cash sweeps, or equity cure mechanisms.
Returns Analysis — Equity IRR and Project IRR
Returns analysis answers the fundamental question for sponsors: is this deal worth the risk? Two metrics dominate PPP deal assessment — equity IRR and project IRR — and they measure different things.
Project IRR (sometimes called unlevered IRR) measures the return on the total project investment before considering how it is financed. It reflects the intrinsic value of the asset and is useful for comparing projects across different capital structures. Equity IRR measures the return specifically to equity investors after debt service — it is always higher than project IRR in a positively leveraged deal, which is why sponsors use leverage in the first place.
Benchmark equity IRR expectations vary by sector, geography, and risk profile. Availability-based social infrastructure in stable jurisdictions might clear at 8–12% equity IRR. Greenfield demand-risk concessions in emerging markets might require 15–20%+ to attract private capital. These ranges are not fixed — they shift with the cost of capital environment and competitive dynamics in any given tender.
A common mistake in bid modeling is reverse-engineering the IRR to hit a target rather than building it from genuine assumptions. Experienced lenders and public authorities can identify this pattern quickly, and it undermines credibility throughout the evaluation process.
Risk Allocation and Its Impact on Financial Assumptions
How risks are allocated in the concession agreement directly determines which assumptions the financial model must stress and which can be treated as relatively fixed.
The risk allocation matrix — a standard deliverable in most PPP tender processes — maps each identified risk (construction, demand, regulatory, force majeure, political) to either the public sector, the private sector, or a shared position. Every risk retained by the SPV must be reflected somewhere in the financial model: either as a cost contingency, a revenue haircut, or an input into sensitivity analysis.
Construction risk is typically retained by the private sector through a fixed-price, date-certain EPC contract. But if the EPC contractor fails to deliver on time or on budget, the SPV bears the consequence — higher IDC, delayed revenue, potential liquidated damages. The model needs to capture this linkage, not treat construction cost as a single static number.
Demand risk is the most complex to model in user-fee concessions. Traffic studies produce point estimates, but lenders finance ranges. The model should include a base case, an upside case, and a downside case derived from the risk matrix — not arbitrary percentage adjustments, but scenario-specific assumptions grounded in the contractual risk allocation.
Sensitivity and Scenario Analysis
Sensitivity and scenario analysis demonstrate that the financial model is robust — not just under ideal conditions, but under the range of outcomes that could plausibly occur over a 25–35 year concession.
A sensitivity analysis tests the impact of changing one variable at a time: what happens to DSCR if traffic is 10% below base case? What if construction costs overrun by 15%? What if the interest rate on floating debt rises by 200 basis points? These single-variable tests reveal which assumptions the model is most exposed to and where risk mitigation (hedging, insurance, reserve accounts) is most valuable.
Scenario analysis combines multiple variables into coherent stories — a "base case," a "downside case," and sometimes a "severe stress" case. Lenders typically require the project to remain covenant-compliant in the downside scenario and solvent (if not covenant-compliant) in the severe stress case. Public authorities use scenario analysis to assess whether the concession structure is sustainable across economic cycles.
The practical output of this section is not just a table of numbers — it is a narrative about where the project is resilient and where it is vulnerable. Bid teams that present sensitivity analysis as a mechanical exercise miss its real purpose: demonstrating to all stakeholders that the sponsors understand the risk profile of what they are building.
Frequently Asked Questions
What software is typically used to build a PPP financial model?
Microsoft Excel remains the dominant tool for PPP financial modeling, often combined with add-ins like Macros or third-party audit tools. Some larger advisory firms use purpose-built infrastructure modeling platforms, but Excel's flexibility and auditability make it the standard in most tender processes. The key requirement is that the model must be transparent and auditable by lenders' technical advisors.
What is the difference between equity IRR and project IRR in a PPP context?
Project IRR measures the return on total project investment before financing costs — it reflects the asset's standalone value. Equity IRR measures the return to equity investors after all debt service has been paid. In a leveraged PPP structure, equity IRR will be higher than project IRR when the cost of debt is lower than the project's return, which is the fundamental rationale for using project finance leverage.
How does the concession period length affect financial modeling outcomes?
A longer concession period allows the SPV more time to recover capital costs through tariff revenues, which generally supports higher leverage and lower required tariffs. However, it also extends the period of demand and regulatory uncertainty, which increases risk. Lenders typically prefer concession periods that match or slightly exceed the loan tenor, ensuring the project generates sufficient cash flows to repay debt before the concession expires.
What makes a PPP financial model "bankable"?
A bankable model demonstrates that the project generates sufficient cash flows to service debt with adequate coverage ratios (typically DSCR above 1.20x–1.30x), that key assumptions are conservative and defensible, that risks are appropriately mitigated or allocated, and that the model remains covenant-compliant under a credible downside scenario. Bankability is ultimately a judgment made by senior lenders and their advisors — the model is the evidence they use to form that judgment.
How are government viability gap funding or subsidies modeled in a PPP structure?
Viability gap funding (VGF) or capital grants from the public sector are typically modeled as equity-equivalent contributions that reduce the total funding requirement for the SPV. They appear in the sources and uses of funds table and reduce the debt quantum needed. Ongoing subsidies or availability payment top-ups are modeled as additional revenue line items with their own escalation and termination provisions, drawn directly from the concession agreement terms.